2D symbology · optical channel

Blur isn't
damage. It's a
low-pass filter.

A QR code treats a smudged module as lost, and spends its redundancy evenly across the finest detail it has — exactly where a lens is weakest. Wavecode puts the payload where the channel still passes it, and decodes what survives instead of rounding it away.

2.1×
blur tolerated vs QR
64 B
payload, QR carries 62
42
units across, QR uses 41

1116 hexagonal cells · rate 1/2 LDPC · 64 bytes

Try it — this decodes for real

Blur them both until
one of them dies.

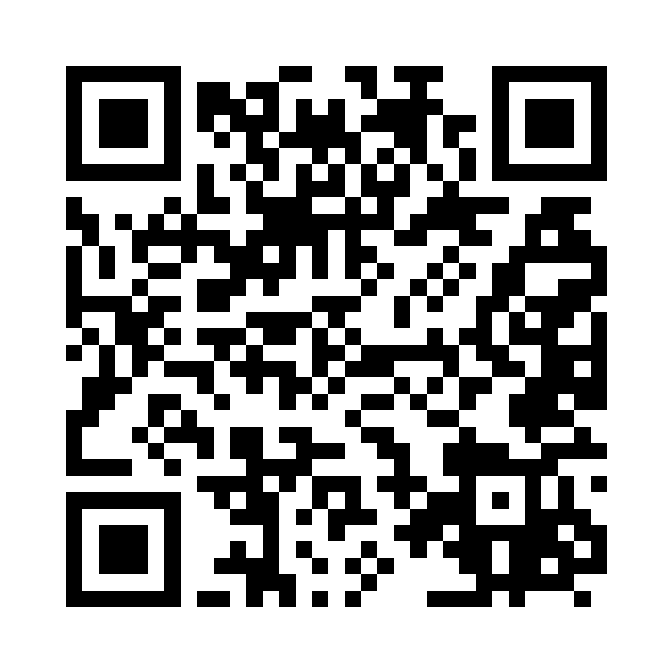
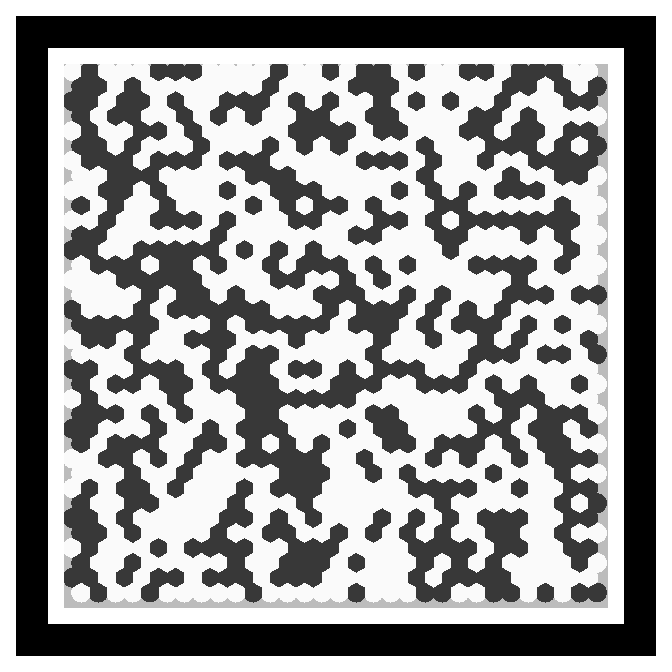
Both carry the identical 47-byte URL — the address of this page — at the same printed size, under the same blur. Nothing here is a mock-up: both images are decoded in your browser every time you move the slider.
Gaussian blur σ, as a share of printed width0.00%
0%0.55%1.1%1.65%2.2%
QR codev4-M · 47 B
QR code under test
ready
Wavecodehexagonal · 47 B
Wavecode symbol under test
ready

Decoded by the same code that runs the scanner · jsQR for the QR, wavecode's own receiver for the other

Encoding

Four steps from
text to texture.

01

Bytes and a checksum

64 bytes of payload plus a 16-bit CRC, so a wrong answer can never be mistaken for a right one.

02

LDPC, not Reed-Solomon

A sparse parity graph at rate 1/2. Belief propagation runs on soft readings, so a faint cell still counts for something instead of being rounded off.

03

Onto a hexagonal lattice

Blur is round, so the sampling grid should be too. Hexagons need 13.4% fewer cells for the same circular bandwidth, and each one ends up bigger.

04

A ring that doubles as a ruler

The solid border locates the symbol, and its own edges measure the camera's blur, which is what tells the decoder how hard to sharpen.

The physics

Contrast dies as a
Gaussian in pitch.

Push a pattern of cell pitch p through a lens of blur radius σ and the contrast that comes back is not a gentle slope. It falls off a cliff, and where that cliff sits depends entirely on how big the cells are.

H = exp( −π² σ² / 2p² )   // contrast at the cell Nyquist
  • 01Geometry beats ink. Six decibels of amplitude buys about 12% more blur tolerance. Bigger cells buy the rest.
  • 02Half the ink is wasted. Where a flat binary design gives out, the optimal power allocation puts zero into 51% of the spatial frequencies. Blur already destroyed them.
  • 03A QR code gets worse as it grows. More payload means a higher version, smaller modules, and less tolerance everywhere at once.
1.00.50 contrast returnedblur σ → wavecode cell QR module
Same symbol size, same lens. The QR module is the finer feature, so its contrast collapses first — and that is where its whole payload lives.

Geometry

A round channel wants
a round lattice.

SQUARE LATTICEHEXAGONAL 21% carries nothing 13.4% fewer samples
Blur is isotropic, so the signal is band-limited to a disc. A square sampling region spends a fifth of its bandwidth on corners the lens never delivers. Petersen and Middleton, 1962.

Swap the square grid for a hexagonal one and the cell centres sit 1.0746× further apart for the same cell count. Cell separation is exactly what blur tolerance scales with, and it costs nothing: every cell still sits at a rail, so there is no peak-to-average penalty to pay for it.

LatticeCellsPayloadHalf-rate crossing
Square115666 B1.480%
Hexagonal111664 B1.549%
Measured, not assumed. At 1.50% blur over 40 trials the square lattice decoded 15 times and the hexagonal 39. Theory predicts 7.5%, we measured 4.7%, and the gap is the hexagonal symbol carrying two bytes less — cells lost where a hexagonal lattice cannot tile a square region.

Graceful failure

Or give up one
layer at a time.

A second variant puts the payload in a Haar wavelet pyramid instead of a flat grid. Every detail coefficient is exactly zero-mean over its parent block, so blurring to a given scale annihilates the fine levels and leaves the coarse ones untouched. Fine detail cannot corrupt coarse detail — by construction, not by margin.

That is only useful if the right information survives longest. The symbol on the test board is an equipment tag, written so the ordering of importance matches the ordering of range: identify it from across the floor, triage it from a few paces, pull the full record with it in your hand.

  • A847213 — which asset. 8-cell detail, still reading at 1.8% blur, when nothing else is.
  • BDUE-0412 — next inspection. 4-cell detail, holds to 1.2%. Enough to know whether to walk over.
  • Cthe full record URL — 2-cell detail, needs 0.8% or better. The detail you only want once you are close.
And it doesn't beat a QR code. Stacking four pyramid levels in one cell makes a roughly Gaussian sum that has to fit the ink range, costing 8.7 dB of peak-to-average backoff. That is precisely why this variant only matches QR while the flat lattice beats it. Take it when a partial read is worth more than the margin.
TIER CTIER BTIER A 0%0.8% 1.2%1.8% record URLDUE-0412 asset 847213 blur, % of width →
One symbol, three payloads at three scales. Each bar shows how far that tier keeps decoding as the view gets worse — the asset number outlasts the URL by more than double.

Live decode

Point it at a code.

Open the benchmark board on a laptop, scan it from a phone, and push the blur up until each one gives out. Fill the frame with one symbol — a code that lands under about four pixels per unit is too small to decode at any sharpness, and the readout will say so.

QR

  1. grayscale
  2. threshold
  3. Reed-Solomon

Untouched on purpose. This is the decoder in every phone today, so what you see it do is what your phone would do.

Wavecode

  1. linearise
  2. fit illumination
  3. Wiener equalise
  4. EM calibrate
  5. refine corners
  6. stack frames
  7. soft LDPC

Corner refinement runs on stills only. Frame stacking sums likelihoods across the last six live frames.

camera idle Start the camera, or take a single photo if your browser blocks live video.
QR
Symbol
Payload
snr —— ms0 framessingle frame

The three-tier symbol drops one row at a time as the view worsens: full URL, then the short code, then just an identifier.

Subjective test board

Blur the board.
Scan from a phone.

All three are the same printed size on screen, and blur is a share of that width — the same unit the measured figures use.

Blur every symbol0.00%
0%0.625%1.25%1.875%2.5%

A phone camera adds its own blur on top, so codes give out sooner here than in the measured figures. The ordering is what matters.

Measured · one set of captures, every decoder

They all fail.
The question is when.

62 bytes, purpose-built both sides. Blur rises until a decoder stops answering.

16 captures per rung · random tilt to 8°, rotation to 15°, sensor noise, gamma and JPEG · drawn from the same measurement file the terminal prints
the four hold everything until they hold nothing, and each reads whatever the one inside it reads, so they are drawn as nested bands rather than four lines on top of one another — the sweep's curve is identical to the single setting's

Blur tolerated, against the QR code as it decodes today

The QR code is not being handicapped. It gets the same deblurring front end: each capture is Wiener-deconvolved in linear light before ZBar sees it. Given that, one baked-in setting does as well as an oracle allowed to try all 22 and keep whichever worked — so the fair baseline is a decoder anyone could ship, not a rigged one.

Where it comes from

Most of the margin is
the receiver, not the symbol.

The blur wavecode survives, split by what buys each part of it

QR today, one attempt
from deblurring alone, on codes already printed
the lattice, on top of that
both together, still one attempt
Two results, and the smaller one is the honest headline. Deconvolving before decoding is worth more than the new symbol is, and it needs no new symbol — it applies to every QR code in the world tonight. What the lattice adds on top of a fully modernised QR pipeline is the smaller number, and it is the one worth defending.

Redundancy

Same area for the payload.
The rest is spent differently.

Wavecode runs at rate one half: every payload bit is matched by a parity bit. A QR code at level M keeps more of its codeword for payload. Counting whole cells rather than codewords shows why the two still land in the same footprint.

Every cell does one of three jobs · structure is the finder squares, timing lines, alignment pattern and format information, which carry no payload either

The trade, in one line. Both symbols give the same share of their area to payload. Wavecode spends almost everything that is left on parity, because one ring and a scatter of calibration cells is the whole of its structure. A QR code spends about as much on structure as it does on parity.
Why the percentages settle less than they look. Reed-Solomon works on bytes that have already been forced to black or white, so it repairs a fixed count and fails one byte past it. Nothing tells it which bytes were doubtful, because thresholding threw that away before it ever ran. The wavecode decoder never thresholds: each cell arrives as a confidence, and belief propagation weighs a thousand uncertain readings against the parity checks at once. There is no error count to exceed, which is why a symbol where every cell is ambiguous can still decode.

Turning the error correction up does not rescue a QR code from blur. Level H repairs far more, but at this payload it needs a larger version, and a larger version means finer modules — which is the thing blur punishes. The benchmark tries every combination and reports the best, and the best is level M.

Fine print

Everything measured,
including what failed.

The detail behind the charts. Four of the techniques tried did nothing at the limit.

How a figure is produced

A master symbol is rendered at 720 px, then put through a simulated camera: perspective tilt drawn uniformly to 8°, in-plane rotation to ±15°, Gaussian blur applied in linear light before sampling, downscale to a 640 px sensor, Gaussian sensor noise at σ = 0.008, sRGB encoding, then JPEG at quality 88. Blur is quoted as a share of printed width, so it is independent of rendering size.

Blur in linear light matters more than it sounds. A lens sums radiance, not gamma-encoded pixel values, so blurring after encoding quietly breaks the block-mean identity the whole scheme rests on and flatters every decoder unevenly.

A limit is the furthest rung on the ladder still decoding at least 90% of the time over 16 captures. Reading the last crossing rather than the first dip matters: several curves dip and recover, and stopping at the first dip scored a working QR version at zero.

Channel termValue
Tilt / rotation0–8° / ±15°
Sensor noise σ0.008
JPEG quality88
Sensor sampling6.4 px per unit
Optical floor, added in quadrature0.15% of width
The optical floor exists because hard module edges alias when a 720 px render is downscaled to 640. Without it a nominally zero-blur capture is sharper than any real lens, which flatters the QR code.
The four contenders in full
62 bytes, same capturesAttemptsBlur limitvs shipped
QR v4-M, as shipped11.00×
QR + one fixed deblur2
QR + 22-setting oracle22
Wavecode, hexagonal1

The fixed setting is a 6 px Gaussian kernel at a noise-to-signal ratio of 0.005, chosen once by sweeping all 21 candidates and keeping the best. It is tried after a plain read, because a kernel that wide destroys a sharp capture — on its own it scores zero below 0.5% blur.

That the oracle adds nothing over the fixed setting is the useful finding. It means the fair baseline is deployable rather than hypothetical, and the wavecode margin is measured against a QR decoder anyone could ship this week.

Not a cell-size advantage. The winning wavecode configuration uses 42 units across against QR's 41, so its cells are slightly smaller. The margin is not bought with coarser ink.
What each technique was worth
TechniqueEffect on the 90% limitEffect elsewhere
Wiener equalisationlargedoubles calibration SNR
Soft decoding over LDPClarge
Hexagonal lattice+4.7%39/40 vs 15/40 at 1.50%
Per-corner refinementnone0.00 → 0.57 at 1.60%
Multi-frame accumulationnone0.92 → 1.00 at 1.50%
Multilevel amplitude cellsneutral to harmful

The hexagonal gain was predicted at 7.5% from Petersen and Middleton's 1962 result that a hexagonal sampling lattice needs 13.4% fewer samples to cover a circular bandwidth. Measured, it is 4.7% — real, and less than theory promises, because the locator ring and quiet zone do not shrink with the lattice.

Four things that did not work

Multi-frame likelihood accumulation. A scanner sees thirty frames a second and decides on each one alone. Summing log-likelihood ratios across eight independent captures instead moved the limit by nothing at all. Blur attenuation is deterministic: the same modulation transfer function multiplies every frame, so eight frames carry eight copies of one bias and averaging cannot remove it. Only the random part — sensor noise, JPEG, the way handheld tilt reshuffles which neighbours bleed into which cell — averages away, and at the threshold that is not what is killing the read. It does firm up the marginal zone, 0.92 to 1.00 at 1.50%.

Multilevel amplitude cells. Four grey levels per cell should buy two bits where one fits. It does not: the contrast between adjacent levels falls as 1/(L−1), and along the Gaussian blur curve that penalty cancels the larger cells the extra bits pay for, almost exactly.

A transform-domain pyramid. The first design put the payload in a Haar wavelet pyramid, which is where the channel is strongest. Superposing four levels in every cell costs 8.7 dB of peak-to-average backoff, and it measured at parity with QR rather than ahead. Ink is amplitude-limited, not power-limited.

Layering as a capacity win. Adding a fine enhancement layer looked free at the 90% threshold and was not: the shoulder below it erodes steadily. Layering earns its place as graceful degradation, not as extra range.

Capacity, and the 1.41× left on the table
At 64 bytesUnitsCapacity
QR v4-M4162 B
Wavecode, hexagonal4264 B

At the point the flat design stops decoding, the channel gain at the cell Nyquist frequency has fallen to 0.0028, and water-filling puts zero power into 51% of the frequency bins.

AllocationPayload bitsBlur tolerated
Flat binary, as built528
Water-filled optimum7451.93%
Why that 1.41× is not taken. A binary grid puts every cell at a rail, so peak equals average. A transform-domain signal is roughly Gaussian and must be backed off, and past about 2.5 dB of backoff it becomes a net loss; multicarrier signals run 8 to 12 dB. Smith proved in 1971 that the capacity-achieving input for a peak-limited channel is discrete, so the route to that 1.41× is a constrained code over discrete cells, not bit loading.
Limits worth stating

Outside the fair-fight figures, comparisons are against open-source QR decoders, ZBar and OpenCV, counting a success if either reads it. Nothing here exploits a weakness in the QR format as opposed to its usual decoders, which is why the fair fight is run and reported rather than left as a caveat.

Every figure comes from a simulated camera. A simulator gets the physics of blur, sampling and gamma right, and gets lens aberration, rolling shutter, motion and print gain wrong or not at all. The live scanner on the demo page is the check on that, and it decodes in the browser with no server involved.

The margin is measured at one payload, 62 bytes. At 128 bytes the full wavecode payload ties a QR code outright, and only the base layer keeps its advantage. This is a result at small payloads, not a general one.